

PA Bill Number: HR466
Title: Recognizing the month of May 2026 as "Sex Ed for All Month" in Pennsylvania.
Description: A Resolution recognizing the month of May 2026 as "Sex Ed for All Month" in Pennsylvania.
Last Action: Referred to Health
Last Action Date: Apr 2, 2026
CPRC: Over 12.8 million concealed handgun permits, last year saw by far the largest increase ever in the number of permits :: 07/16/2015
The new report is available here. Part of the executive summary is shown here:
Since President Obama’s election the number of concealed handgun permits has soared, growing from 4.6 million in 2007 to over 12.8 million this year. Among the findings in our report:
- The number of concealed handgun permits is increasing at an ever- increasing rate. Over the past year, 1.7 million additional new permits have been issued – a 15.4% increase in just one single year. This is the largest ever single-year increase in the number of concealed handgun permits.
- 5.2% of the total adult population has a permit.
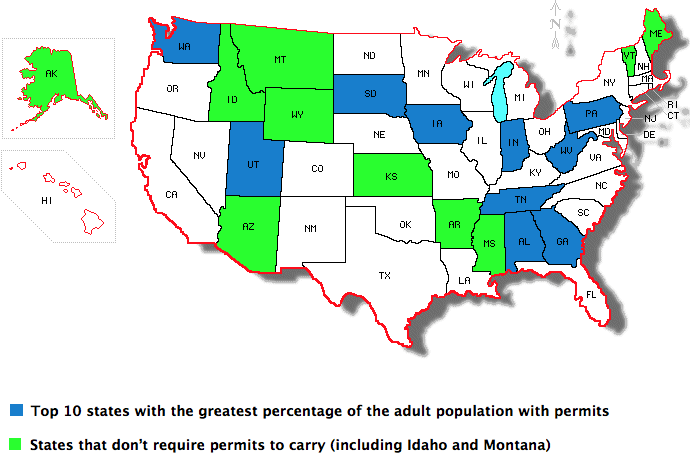
- Five states now have more than 10% of their adult population withconcealed handgun permits.
- In ten states, a permit is no longer required to carry in all or virtually all ofthe state. This is a major reason why legal carrying handguns is growing somuch faster than the number of permits.
- Since 2007, permits for women has increased by 270% and for men by 156%. Over that period, there was a 178% increase in total permits.
- Some evidence suggests that permit holding by minorities is increasing more than twice as fast as for whites.


UPDATE:
Arizona — 239,259 July 5, 2015 to 251,333 January 17, 2016 (gender, race and county breakdown)
California — the state had 59,808 permits on December 31, 2015, about 0.2% of the adult population. While nine smaller counties have between 2.5 and 4.5 permits per 100 people, the large counties have thousandths of one percent. More data on permits is available here.
Colorado — 165,528 December 31, 2014 to 196,329 December 31, 2015
Delaware — “surge” in concealed handgun permits in Delaware
District of Columbia — there were 44 approved permits out of 206 applicants as of September 8, 2015.
Florida — 1.415 million June 30, 2015 to 1.465 million Octobern 2015 to 1.474 million November 2015 to 1,488,028 December 2015 (Florida by county on December 31, 2015, Florida by gender)
Illinois — 103,000 March 2015 to 119,337 June 6, 2015 to 143,386 December 31, 2015 (Richard Pearson, ISRA)
Iowa — 220,000 December 2014 to 250,000 December 2015
Kansas — 94,093 March 2015 to 100,000 in May 2015
Kentucky — given five year permits it appears as if going from December 31, 2013 to December 31, 2014 increased the number of permits by about 23,000
Indiana — 595,361 June 30, 2015 to 630,000 in January 2016
Iowa — 220,000 in December 2014,to 254,000 in January 2016.
Michigan — 500,943 June 30, 2015 to 516,612 February 1, 2016, 539,036 March 24, 2016 (7.35% of adult population with guns) (The three most populous counties in order 96,101 permits in Wayne County (population 1.79m); 67,241 in Oakland County (1.22m), and 48,795 in Macomb County(0.847m))
Minnesota — 194,905 April 30, 2015 to 200,000 August 22, 2015, 19 percent of permit holders are women) to 210,647 November 30, 2015
West Virginia — 126,514 December 2013 to 147,801 Dec. 31, 2014
Montana — some new county numbers are available here.
Nebraska — 37,045 March 8, 2015 to 42,000 December 2015
New Mexico — 40,794 December 31, 2014 to 61,000 December 31, 2015
North Carolina — 484,630 June 10, 2015 to 478,334 in December 2015 (36,667 were for women)
North Dakota — 40,888 in December 31, 2013 to 40,872 December 31, 2015
Oklahoma — 217,724 March 2, 2015 to 238,300 January 23, 2016
South Carolina — 253,339 February 10, 2015 to 276,084 December 31, 2015
South Dakota — 81,222 in March 19, 2015 to 85,273 on December 31, 2015
Tennessee — 504,384 June 10, 2015 to 529,661 in January 4, 2016 (data over time for Tennessee is available here) 543,851 on March 2, 2016.
Texas — as of October, 2015, Texas had 922,197 active permits (see also WSJ), up from 841,500 in the spring. As of December 31, 2015 there were 937,419 active permits.
Utah — 603,144 Total Valid Permits as of March 31, 2015, 202,637 Permit Holders are Utah residents to 623,969 Total Valid Permits as of September 30, 2015, 208,640 Permit Holders are Utah residents. 632,276 total valid permits and 212,349 Utah residents on December 31, 2015
Virginia — 387,054 on March 16, 2015, 420,000 December 2015
Wisconsin — 253,116 May 2015 to just under 285,000 in January 2016, 300,000 on March 24, 2016.
Total in report 12,802,740, updated with just these 15 states the total is now 13,328,665. For many of these states this is just the change over 6 months.
