PA Bill Number: HB2216
Title: In juvenile matters, providing for special immigrant juvenile status predicate orders.
Description: In juvenile matters, providing for special immigrant juvenile status predicate orders. ...
Last Action: Referred to Judiciary
Last Action Date: Feb 12, 2026
CPRC: Murder and homicide rates before and after gun bans :: 12/01/2013
Original post: Every place that has been banned guns has seen murder rates go up. You cannot point to one place where murder rates have fallen, whether it’s Chicago or D.C. or even island nations such as England, Jamaica, or Ireland.
UPDATE: An interview that John Lott had on this post on Cam & Company is available here (SiriusXM Channel 125).
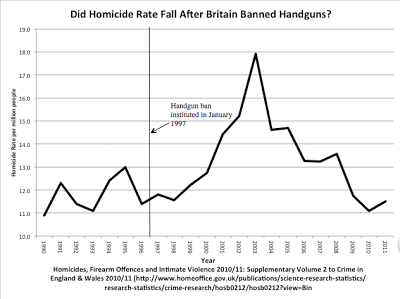
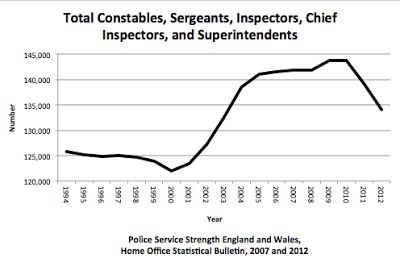
For an example of homicide rates before and after a ban, take the case of the handgun ban in England and Wales in January 1997 (source here see Table 1.01 and the column marked “Offences currently recorded as homicide per million population”). After the ban, clearly homicide rates bounce around over time, but there is only one year (2010) where the homicide rate is lower than it was in 1996. The immediate effect was about a 50 percent increase in homicide rates. The homicide rate only began falling when there was a large increase in the number of police officers during 2003 and 2004. Despite the huge increase in the number of police, the murder rate still remained slightly higher than the immediate pre-ban rate.
There are a lot of issues about how different countries measure homicide or murders differently, but that isn’t really relevant for the discussion here as we are talking about changes over time within a country.
Other information for Ireland and Jamaica.
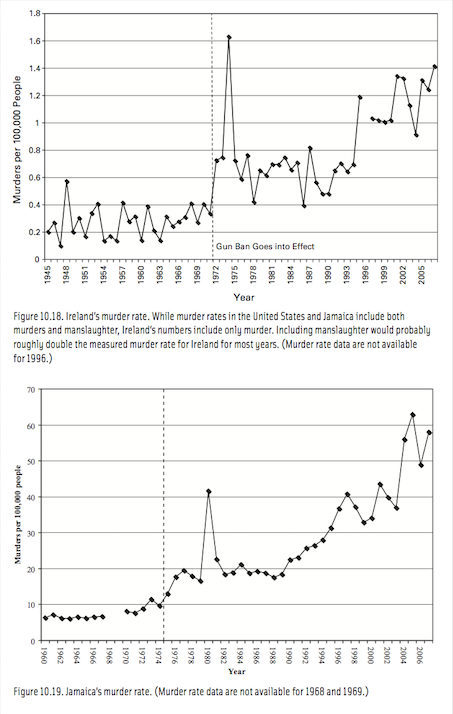
Jamaica’s crime data were obtained from a variety of sources. Its murder data from 1960 to 1967 were obtained from Terry Lacey, Violence and Politics in Jamaica, 1960–70 (Manchester: Manchester University Press, 1977). Professor Gary Mauser obtained the data from 1970 to 2000 from a Professor A. Francis in Jamaica and the data from 2001 to 2006 from the Statistical Institute of Jamaica (http://www.statinja.com/stats.html). Jamaica’s population estimates were obtained from NationMaster.com (http://www.nationmaster.com/graph/ peo_pop-people-population&date=1975).
How about for DC and Chicago (Figures taken from More Guns, Less Crime)?
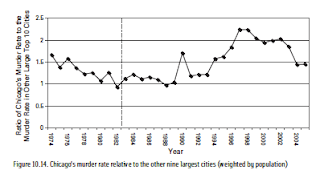
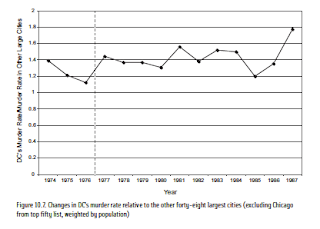
The raw data for DC over a long period of time is available here (the crime rates are available on the bottom half of the screen).
Now Australia didn’t have a complete ban on guns, they didn’t even ban all semi-automatic guns, but a discussion on the changes in their crime rates from their gun buyback is available here (see also here).
Much of the debate over gun control focuses on what is called “cross-sectional” data. That is crime rates are examined at one particular point of time across different places. Here are two paragraphs from John Lott’s The Bias Against Guns that explain the basic problem with cross-sectional analysis.
First, the cross-sectional studies: Suppose for the sake of argument that high-crime countries are the ones that most frequently adopt the most stringent gun control laws. Suppose further, for the sake of argument, that gun control indeed lowers crime, but not by enough to reduce rates to the same low levels prevailing in the majority of countries that did not adopt the laws. Looking across countries, it would then falsely appear that stricter gun control resulted in higher crime. Economists refer to this as an “endogeniety” problem. The adoption of the policy is a reaction to other events (that is, “endogenous”), in this case crime. To resolve this, one must examine how the high-crime areas that chose to adopt the controls changed over time —not only relative to their own past levels but also relative to areas that did not institute such controls.
Unfortunately, many contemporary discussions rely on misinterpretations of cross-sectional data. The New York Times recently conducted a cross-sectional study of murder rates in states with and without the death penalty, and found that “Indeed, 10 of the 12 states without capital punishment have homicide rates below the national average, Federal Bureau of Investigation data shows, while half the states with the death penalty have homicide rates above the national average.” However, they erroneously concluded that the death penalty did not deter murder. The problem is that the states without the death penalty (Alaska, Hawaii, Iowa, Maine, Massachusetts, Michigan, Minnesota, North Dakota, Rhode Island, West Virginia, Wisconsin, and Vermont) have long enjoyed relatively low murder rates, something that might well have more to do with other factors than the death penalty. Instead one must compare, over time, how murder rates change in the two groups – those adopting the death penalty and those that did not.
More information is available in chapters 2 and 10 of More Guns, Less Crime (University of Chicago Press, 2010, third edition).
A cross country comparison and the problems with such a comparison is available here.
http://crimeresearch.org/2013/12/murder-and-homicide-rates-before-and-after-gun-bans/


